Online Trading Masterclass Series 1 – ZIP (ASX) Technical Analysis & Market Structure

Online Trading – Chart Structure Step-by-Step Analysis
This online trading masterclass shows how professional chart structure is built using the ASX stock ZIP as a real market example. What you are about to see is the finished result of a disciplined process built on structure, proportion, and market behaviour. This is not a trading signal page and it is not a prediction page. It is a real demonstration of how serious chart preparation looks before execution is ever considered.
Most people are shown charts the wrong way. They are taught entries before structure, indicators before context, and opinions before process. That is why so many beginners feel confused. This page is designed to reverse that. Instead of guessing, you will see how a blank chart becomes a structured decision framework layer by layer.
You do not need to understand every line yet. The purpose of this masterclass is to let you see the difference between random charting and professional preparation. Once you understand structure, the same framework can be applied across shares, Exchange Traded Funds (ETFs), futures, indices, and crypto markets. The instrument may change. Structure does not.
Understanding The Type Of ASX Stock You Are Looking At
ZIP (ASX) is considered a high-growth ASX fintech and buy now pay later stock. Unlike defensive dividend-focused companies, high-growth technology and fintech stocks often produce faster price movement, higher volatility, and stronger momentum behaviour.This creates a very different chart structure compared to defensive financial stocks such as QBE or dividend-focused infrastructure companies such as TLS.
Understanding the type of stock being analysed is an important part of professional market preparation because different sectors often produce different volatility, trend behaviour, growth expectations, and risk profiles.High-growth ASX stocks are often heavily influenced by investor sentiment, earnings growth forecasts, interest rate expectations, and broader technology market conditions. This is why momentum behaviour and risk management become extremely important when analysing companies like ZIP.
Online Trading – Why ZIP Was Selected
ZIP was selected because it represents a high-volatility ASX growth stock capable of producing powerful momentum phases, deep corrections, rapid sentiment shifts, and aggressive structural expansion. This makes it one of the strongest educational examples for studying modern market behaviour.
Unlike slower defensive companies, ZIP demonstrates how emotionally driven growth stocks can accelerate quickly when momentum, earnings expectations, sector optimism, and market sentiment align together. These types of stocks often expose both the opportunity and danger of trading without structure.
ZIP also provides an ideal environment for studying trend continuation, breakout behaviour, retracement zones, support and resistance reactions, and market psychology. Growth stocks can move aggressively in both directions. This is why structure, proportional measurement, and disciplined preparation become critical.
Each chart in this masterclass builds directly on the one before it. Nothing random. Nothing decorative. Every level must earn its place. If you have ever looked at a fast-moving stock and felt overwhelmed by the speed of movement, this page is designed to help simplify the process.
You are about to see how professional market preparation turns chaotic price movement into a structured decision framework. Once structure becomes visible, the market starts becoming far easier to read objectively rather than emotionally.
Start with the first chart below. Then follow each layer as new information is added and the market picture becomes clearer.
Online Trading-Chart 1-ZIP Monthly Chart Structure
Online Trading – Chart 1 – ZIP Monthly Chart Structure
Take a moment to study this first chart carefully.
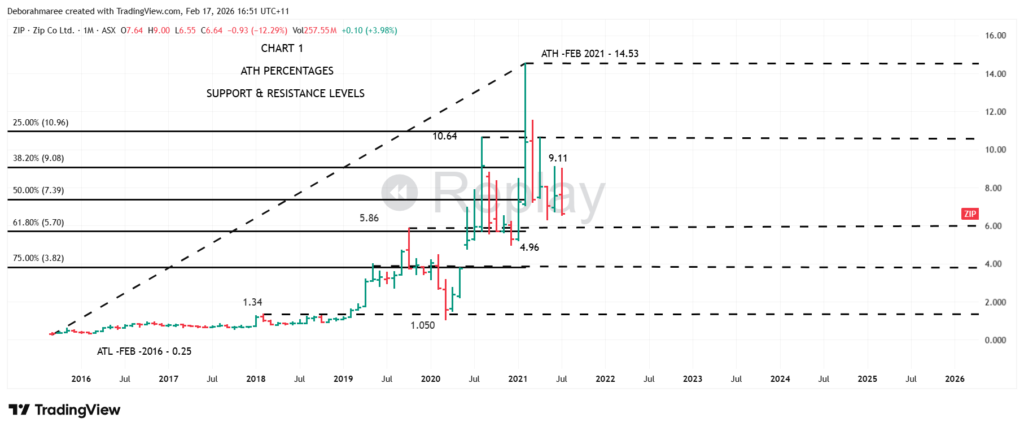
This is the monthly ZIP chart and it shows the first structural layer of the analysis. On this chart we have marked the all-time low at $0.25 and the all-time high at $14.53. Between those two extremes, the major proportional retracement levels at 25%, 38.2%, 50%, 61.8%, and 75% have been mapped. These levels create the higher-timeframe framework of the full market cycle and define the range we are analysing.
We have also marked the major support and resistance levels already proven by price. Key structural zones can be seen around $1.34, $1.050, $4.96, $5.86, $9.11, and $10.64. These are areas where the market has previously reacted, stalled, accelerated, or reversed. That makes them important reference points for the next layers of analysis.
At this stage, the purpose is not to predict the next move and it is not to teach the full chart-building process. The purpose of this masterclass is to show you what a professionally prepared chart looks like once the structural work has already been completed. We are showing you the finished analysis, not the full method behind it.
Chart 1 matters because everything added later must sit inside this framework. If the higher-timeframe structure is wrong, every lower layer becomes weaker. This chart is the structural spine of the entire ZIP market cycle.
The next chart builds directly on this foundation and shows how additional layers begin aligning with the framework you see here. If you want to learn how this process is actually done step by step, that is what the She Trades Shares Trading For Beginners E-Book is designed to teach.
Want To See What’s In Side The Trading For Beginners Course Before You Buy?
See What You Get Inside The E-Book For $49Online Trading-Chart 2 – Monthly ZIP Support and Resistance & Wave Analysis
Online Trading – Chart 2 – ZIP Monthly Chart Structure & Wave Analysis
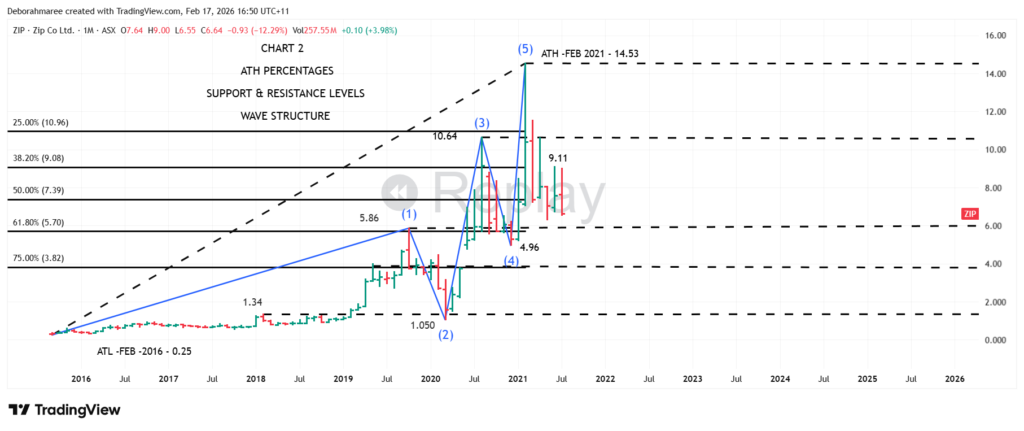
Chart 2 takes what you saw in Chart 1 and deepens it. In Chart 1, we identified the structural spine of ZIP — the all-time high, the proportional retracement zones, and the major support and resistance levels already proven by price. That gave us context. Now we build on it. This chart keeps the same higher-timeframe structural framework from Chart 1, but now introduces wave structure and behavioural progression. You can now begin seeing how expansion and correction unfold inside the existing framework. Markets do not move randomly between levels. They move in sequences, reactions, and proportional swings. This is where static structure begins turning into behavioural structure.Notice how the $14.53 all-time high remains the dominant structural ceiling. Beneath it, the $10.64 region and the $5.86 region begin forming repetitive reaction zones. The $3.98 area, which sits close to the deeper retracement level, becomes particularly important during long-term repair phases. And the $1.34 region represents the final structural memory before expansion began.
This is where online trading starts to become logical rather than emotional.
We are not adding indicators for noise. We are identifying behavioural checkpoints. Each level exists because the market has already proven it matters. Structure is not drawn randomly. It is earned through repetition and reaction.
You will also notice that these horizontal levels now overlap with the percentage retracements from the previous chart. That overlap is called confluence. Confluence is where probability strengthens because multiple structural tools are agreeing in the same price zone. Professionals do not trade single lines. They trade areas of agreement.
Behind the scenes, full fundamental and balance sheet analysis has already been completed. That layer is not shown here. For the purpose of this masterclass, we are isolating structure only. Financial analysis and risk calibration are taught step-by-step inside the She Trades Shares structured course. Here, we are focused purely on how clean structure is built.
Chart 2 is not about prediction. It is about framing.
You are beginning to see how a blank chart transforms into a mapped framework. And this is still only the foundation. The next chart builds further — adding behavioural structure and wave progression to show how expansion and correction phases actually unfold inside that framework.
- Each chart stacks on top of the previous one.
- By the time you reach the final chart, what once looked confusing will begin to look controlled.
- That is the difference between guessing and structured online trading.
If this level of structure feels different from what you normally see online, that is the point. The full step-by-step framework — including how to build this from scratch, validate it correctly, protect risk, and apply it consistently — is taught inside the complete She Trades Shares E-Book.
Chart 3 will now take this structural foundation and expand it into projection mapping and confluence analysis so you can begin seeing how future movement may unfolds inside mapped structure.That is where it starts becoming powerful.
Are You Ready To Stop piecing trading together.
Start Learning Trading The Right WayOnline Trading-Chart 3-Weekly Projection Mapping & Confluence
Online Trading – Chart 3 – ZIP Weekly Projection Mapping & Confluence
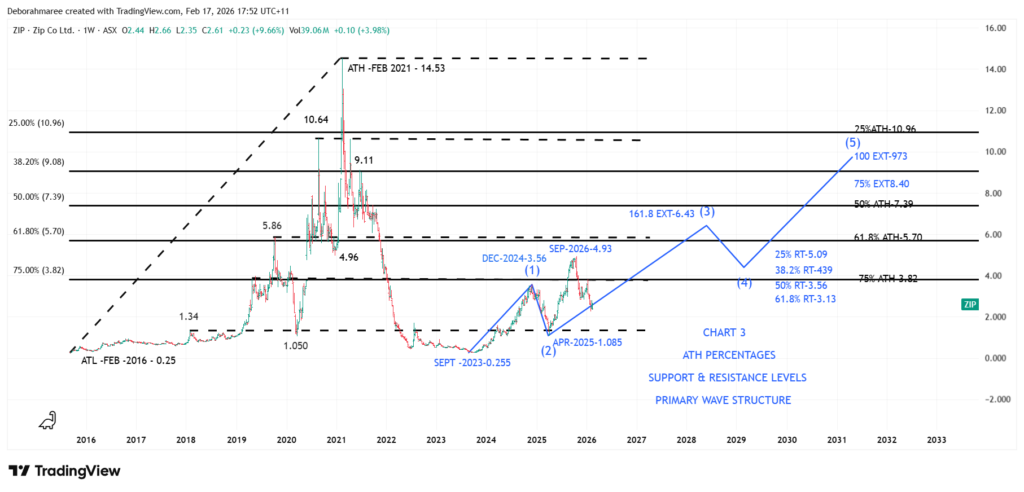
Chart 3 builds directly on Chart 2.The structural foundation remains the same. The all-time high percentages remain in black. The major support and resistance levels remain in black. Nothing has been removed.
What has now been added is proportional projection and mapped extension behaviour — and that is marked in blue.
The primary wave structure introduced in Chart 2 now begins expanding into projected retracement and extension pathways. This allows us to measure how future movement may unfold if behaviour remains structurally proportional.
The blue wave structure represents the current recovery sequence developing from the September 2023 low. This is not hindsight plotting. It is structural mapping based on observable expansion and correction behaviour.
You will notice that the projected extensions and retracements are also drawn in blue. This is deliberate. Black represents historical structure. Blue represents active behavioural progression. When black and blue begin to align, that is where confluence emerges.
For example, the projected 161.8% extension of the current recovery sequence sits near $6.43. That level does not exist in isolation. It interacts with prior structural zones already defined in Chart 2.
This is not a prediction. It is the minimum structural expectation when a recovery sequence begins expanding from a confirmed wave two low. The 161.8% extension is textbook proportional behaviour — but until structure confirms, it remains a mapped possibility, not a forecast.
If price were to complete a 161.8% extension, textbook wave behaviour would then expect a corrective pullback — commonly into the 38.2% region of that expansion. Again, this is structural proportion. Not certainty. Not guarantee. Proportion.Only after that corrective behaviour completes would a 100% extension target near $9.73 become structurally visible as a higher wave objective.
Notice what is happening visually on the chart.
- Black levels represent historical proportion and memory.
- Blue levels represent current behavioural expansion and measured projections.
- Where black and blue overlap, structural probability strengthens.
This is how layered chart construction creates clarity. We are not guessing where price will go. We are measuring where structure permits movement to travel if behaviour remains proportionally consistent.At this monthly stage, this is all the information available.There is no anticipation. No bias. No emotional prediction.The monthly chart provides structural possibility. It does not provide execution detail.
To understand whether this mapped projection is realistic, overstretched, or internally supported, we would then break down to the weekly timeframe to examine internal wave behaviour. But that is the next layer.Right now, you are seeing how professional online trading analysis blends historical proportion (black) with active behavioural mapping (blue) to identify confluence zones before emotion ever enters the decision process.
This structured, layered methodology — including how to measure extensions correctly, validate retracements, manage invalidation points, and protect risk — is taught step-by-step inside the She Trades Shares E-Book. What you are observing here is the finished product of that framework applied to a live ASX market structure.
Online Trading-Chart 4 – Weekly Internal Structure
Online Trading – Chart 4 – ZIP Weekly Internal Structure Check (Hierarchy Test)
This chart is where the analysis becomes “adult.” The monthly framework is still the boss, but the weekly chart is where we test whether the monthly projection is structurally valid inside real internal movement. This is not prediction. This is conflict detection and hierarchy checking.
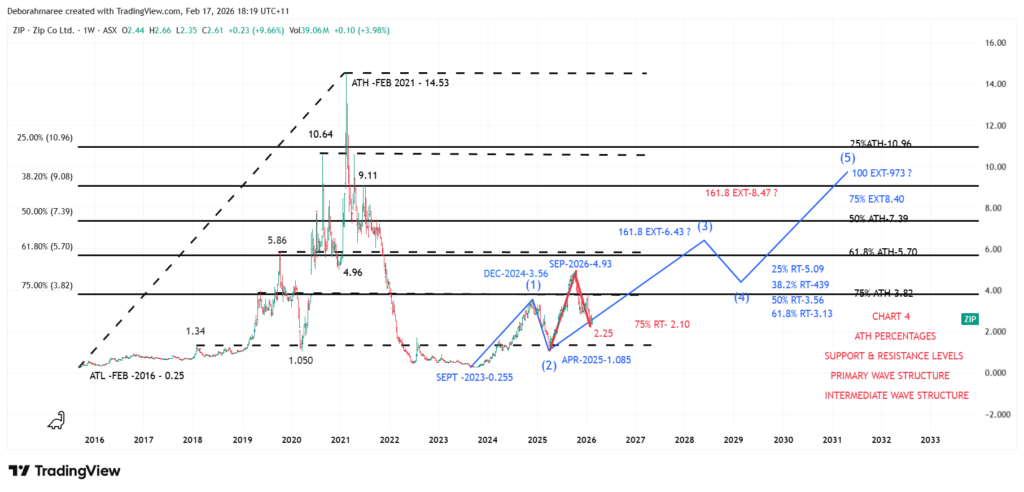
You will notice 3 layers working at once. The black levels remain the same all-time high percentages and the same support and resistance framework. The blue mapping remains the primary wave projection we built from the higher timeframe. What is new is the red internal wave behaviour on the weekly chart, which is the “inside story” that either supports the monthly idea or forces a recalculation.
What you are looking at on Chart 4
- Black: All-time high percentage levels and the major support and resistance zones.
- Blue: The primary wave structure projection from the monthly framework.
- Red: The intermediate internal wave structure on the weekly chart used to test proportional integrity.
The weekly internal structure gives us measurable information that the monthly chart cannot give on its own. If the internal measurements stay “inside” the broader monthly pathway, the monthly projection remains structurally stable. If the internal measurements project beyond the monthly pathway, the hierarchy is telling us something important: the larger count may need to be extended or re-labelled to remain valid.
Here is the key structural discovery on this chart
- The retracement from the intermediate internal wave 1 into wave 2 measures approximately 75%, near $2.10.
- A 75% retracement is deep, but it can still be structurally acceptable when behaviour remains proportional.
- The minimum 161.8% extension of that internal sequence measures near $8.47.
Now the critical thinking moment. On the monthly chart, the earlier minimum 161.8% extension projection was around $6.43 in blue. On the weekly chart, the internal 161.8% extension in red is projecting around $8.47. That creates a mismatch, because the internal pathway is now larger than the higher timeframe pathway it is supposed to sit inside.
This is exactly why the question marks exist. They do not mean “it will go there.” They mean “if internal structure is demanding $8.47 to remain proportionally valid, then the earlier monthly projection to $6.43 is likely incomplete, and the primary wave count may need to be extended or re-evaluated.” That is how a professional chart stays honest instead of forcing a narrative to fit.
What Chart 4 proves (without giving away execution)
- Monthly structure is the framework, but weekly structure is the verification layer.
- Confluence is not just “levels lining up,” it is also “timeframes agreeing.”
- When internal projections exceed higher timeframe projections, hierarchy must be reassessed before any execution logic is even considered.
Important note
Nothing on this page is a trade call. This is a structural demonstration only. Execution, entries, invalidation rules, and risk calibration are taught step by step inside the She Trades Shares structured course, not on this masterclass page.
Bridge to the full learning (this is where the real course starts)
If you are reading this and thinking “I want to understand how to build charts like this,” that is the point of the masterclass. You are not meant to understand every label yet. You are meant to see what clean structure looks like once the full process has been applied properly.
Inside the Trading For Beginners E-Book (the complete step-by-step structured course), you do not just learn ZIP. You learn the full top-down methodology from start to finish, so you can build structure across any stock without guessing, without chasing hype, and without relying on random indicators as a shortcut.
What you learn inside the E-Book and structured course
- Top-down analysis: Monthly first, then weekly, then daily for timing only.
- How to build a chart properly: Structure, levels, and clean decision zones.
- How to use Fibonacci proportion as a structure tool, not a prediction tool.
- How to understand wave behaviour and why internal structure can override a “nice looking” projection.
- Risk and behaviour reality: How professionals protect capital before they try to grow it.
- Trading psychology: How to stop reacting emotionally and start thinking in process.
- The core technical toolkit: Moving averages, RSI, MACD, and volume (used as confirmation, not signals).
- A complete structured workflow with 13 sections that removes guesswork and creates consistency.
This masterclass will continue to build chart by chart, layer by layer, so you can see what the finished product looks like in real market conditions. The full “how to do it” framework, the rules, and the execution layer remain inside the paid structured course.You’ve Seen The Analysis. Now Learn To Do It Yourself.
Ready to build real trading confidence?
Yes, Take me straight to the sales page.Online Trading-Chart 5 – Weekly – Market Structure and Trend Confirmation
Online Trading – Chart 5 – Weekly ZIP Chart
Up to this point, you have seen how the monthly framework defines the range and the key proportion levels, and how the weekly chart is used as the verification layer to test whether the internal structure supports the ok higher timeframe map.The next step is to watch that structure move in real time. This is where the analysis shifts from static levels to live behaviour. The purpose of Chart 5 is not to teach execution. It is to show how a professionally prepared structure is tracked as it evolves, bar by bar, without prediction and without emotion.
Chart 5 focuses on weekly market structure and the sequence of Higher Highs and Higher Lows that built the prior trend, followed by the first confirmed structural breaks that signal a change in condition. This is how traders stay aligned with what price is actually doing, rather than what they hope it will do.
Online Trading-Chart 5 Analysis.
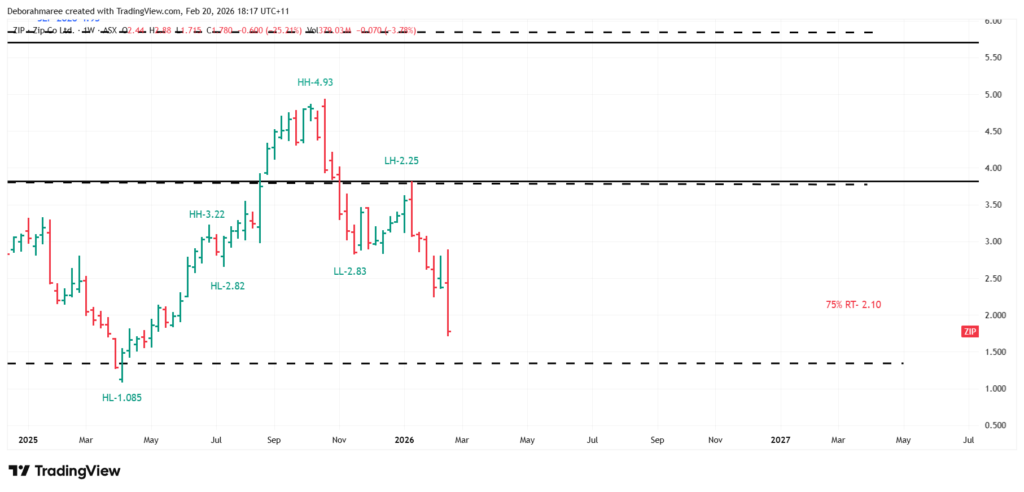
This weekly chart begins from the established structural low at $1.085. From that point, price builds a rising sequence that can be tracked as a progression of Higher Highs and Higher Lows. The key purpose of this labelling is not to “name” bars. It is to confirm whether the market is still expanding upward in an orderly way, or whether that behaviour has started to fail.
In this sequence, it is normal to see pauses and compression bars such as inside bars and outside bars. Those bars do not automatically create a new swing point on their own. They often represent consolidation or range expansion inside the same structural leg. The correct approach is to treat them as a “wait” condition until the next structural decision becomes clear.
As price continues upward, the trend remains valid while the sequence of Higher Highs and Higher Lows continues to hold. That is the behavioural definition of an uptrend on the weekly chart. You are not guessing. You are measuring.
The critical change happens after the peak around $4.93. Once a Lower Low forms near $2.83, the prior rising sequence is no longer intact. That is the first clear warning that the market has shifted from expansion into a different condition. After that, the rally into the Lower High near $2.25 confirms that the recovery attempt has failed to restore the previous trend behaviour.
At this point, the chart is no longer in “trend continuation” mode. It is in “trend change and reset” mode. The correct response is not to force an entry. The correct response is to wait for price to build the next measurable structure that proves a new sequence is forming.
You will also notice that this structural change is occurring inside a major confluence zone. That zone is defined by historical support and resistance memory and the deeper percentage retracement levels from the all-time high. When structure and proportion overlap, the market often reacts more aggressively, because more than 1 framework is participating in the same region. This is not a prediction. It is an explanation of why this area matters structurally.
From here, the masterclass continues to track behaviour as it unfolds. The goal is to show you what disciplined structure-tracking looks like in real market conditions, without turning the process into a trade call. Execution rules, invalidation rules, and risk calibration belong inside the complete She Trades Shares structured course. The masterclass shows the finished work. The course teaches you how to do it yourself.
Are You Seriously Ready To Build Real Trading Charts Yourself?
Yes, Take me straight to the sales page.Online Trading-Chart 6 – Weekly Market Structure and Trend Confirmation Continuation
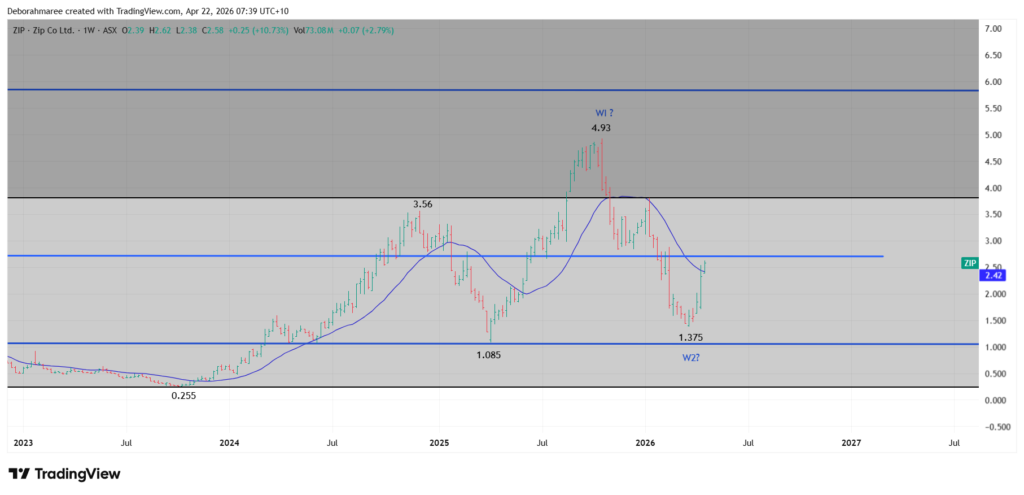
Chart 6 builds directly on the work completed in Chart 5. The previous chart identified a confirmed structural breakdown from the prior uptrend and showed why patience was required before making any new assumptions. At that stage, the correct decision was to wait for fresh evidence. This chart shows what happened next.
Price has now rebounded from the $1.375 region, which is not a random level. That area sits near prior support and resistance memory and inside the deeper retracement zone between the 75% and 100% pullback of the all-time high range. When historical structure and proportional levels meet in the same region, that creates confluence. Confluence does not guarantee a reversal, but it explains why this zone deserved attention.
The rally that followed tells us buyers responded to that area. However, one bounce alone does not confirm a new long-term trend. This is where disciplined analysis matters. We do not label a new bull move simply because price has risen from support. We measure whether structure can continue building.
The $4.93 peak is now an important reference point. It sits close to a prior structural level and near the mid-range proportion zone of the larger market cycle. That makes it a meaningful decision area, not just another price print on the chart.
You will also notice the moving average has been added. Here it is being used as a trend guide, not a signal generator. During stronger advances, price tends to hold above a rising moving average. During weaker phases, price often falls below it or struggles to reclaim it. That means the moving average helps us judge trend health, but it does not replace structure.
This leaves the key question for the current market phase. Is the rebound from $1.375 the beginning of a new Wave 1 advance, or is it only part of a larger Wave 2 recovery inside a broader corrective structure? At this stage, both possibilities remain open. Serious traders do not force certainty before the chart has provided enough evidence.
The correct focus now is simple. Watch whether price can build higher lows, reclaim key resistance levels, and maintain strength above the moving average. If it can, the bullish case strengthens. If it fails, the market may still be inside a larger corrective process.
This is the difference between guessing and professional chart work. We are not predicting outcomes. We are reading evidence as it appears.
Yes I Definitely What To Learn How To Do This?
Take me straight to the sales page.Updated 19/05/26 – ZIP Fundamental Analysis – ASX Buy Now Pay Later Growth Stock
ZIP Co operates inside the fast-moving buy now pay later sector, making it one of the more aggressive ASX growth stocks compared to traditional dividend-focused companies.
Unlike defensive businesses, ZIP’s share price behaviour is heavily influenced by consumer spending, interest rates, credit market conditions, and investor sentiment toward high-growth technology and fintech companies.
From a valuation perspective, Simply Wall St currently identifies ZIP as trading below estimated future cash flow value. Analyst forecasts also continue projecting strong future earnings growth and revenue growth over the coming years.
ZIP Earnings Growth, Revenue Growth and Financial Risks
One of the strongest areas currently supporting the ZIP share price is the company’s earnings growth profile. Past earnings growth has been significantly stronger than the broader consumer finance industry, while analysts continue forecasting future earnings expansion.
ZIP is forecast to grow earnings by approximately 24% per year, with revenue expected to continue growing strongly as the business expands and operational efficiency improves.
However, investors also need to understand that ZIP carries substantially higher financial risk than many traditional ASX companies. The company still operates with elevated debt levels and tighter interest coverage ratios compared to more conservative businesses.
This means ZIP remains more sensitive to changes in interest rates, economic slowdowns, credit conditions, and overall market sentiment.
Updated 18/06/26 – ZIP Profitability, Forecast Growth And Risk Check
Since the previous ZIP fundamental update on 19/05/26, the company’s profile has continued to show a mix of improving growth conditions and important financial risks.
ZIP has now returned to profitability, which is a meaningful development for a high-growth buy now pay later business. Analyst forecasts continue pointing to strong future earnings growth of approximately 23% to 24% per year, with revenue expected to keep growing as the business expands and improves operational efficiency.
However, ZIP still remains a higher-risk growth stock. The company carries elevated debt levels, and interest payments are not strongly covered by earnings. This means changes in interest rates, credit conditions, consumer spending, funding costs, and market sentiment remain important risks to monitor.
From an educational perspective, this reinforces why ZIP is useful inside this masterclass. It is not a simple defensive stock. It is a growth company where technical structure, fundamental context, risk awareness, and market behaviour all need to be considered together.
This update does not change the purpose of the masterclass. ZIP remains an example of structured chart analysis, not a trading signal or recommendation.
Explore ZIP Financials, Valuation And Growth Forecasts
View ZIP On Simply Wall StZIP Share Price Outlook and Fundamental Conclusion
Following the latest update, ZIP continues to represent a higher-risk, higher-reward ASX growth stock whose future performance remains closely tied to execution, profitability growth, consumer finance conditions, and broader market confidence..
The combination of improving profitability, strong analyst growth forecasts, and expanding earnings expectations helps support the broader technical analysis structure already discussed throughout this masterclass.
At the same time, traders and investors should understand that ZIP remains significantly more volatile than traditional ASX blue-chip stocks. Strong momentum can create rapid upside moves, but periods of market weakness can also produce large drawdowns.
For this reason, both technical analysis and ongoing fundamental monitoring remain extremely important when managing positions in high-growth ASX technology and fintech stocks like ZIP.
Resources 🔗
This is Series 1of a 4 part series Online Masterclass including ZIP(ASX), PLS(ASX), QBE(ASX) – TLS(ASX)
Once you have finished analizing this post you can then move on to the next Series featuring PLS (ASX), QBE(ASX),TLS(ASX) Start here first, then click below to view the other masterclasses. You can then compare how the same structure applies to a different market. Once you’ve started learning the framework, you can explore additional tools, walkthroughs, and resources inside the She Trades Shares Hub
Trading for Beginners Guide – The Ultimate Resource Hub
Masterclass Series
View Online Masterclass PLS – Series 2 Here
View Online MasterClass QBE – Series 3 Here
View Online MasterClass TLS – Series 4 Here

One Comment