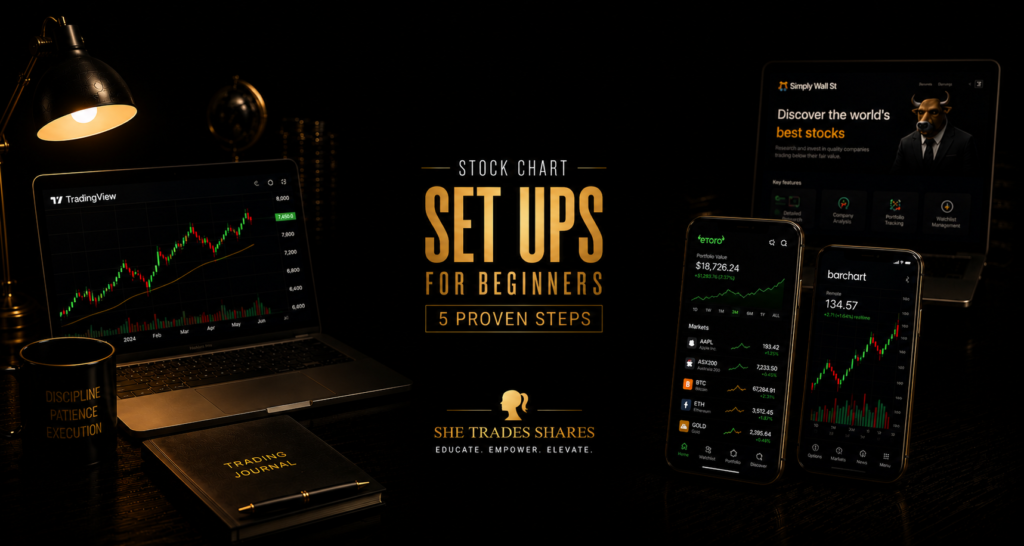
Stock Charts Setup For Beginners. How I Set Up My ASX Charts In TradingView Step By Step
When most beginners first open TradingView, they immediately become overwhelmed because there are hundreds of indicators, endless drawing tools, flashing menus, and chart settings all competing for attention at once. Many beginners assume a professional stock chart setup must look complicated, with multiple indicators stacked on top of each other and every possible tool turned on. The truth is usually the opposite. A clean chart setup helps you see price behaviour more clearly, while a cluttered chart makes even simple market structure feel confusing. Stock charts setup for beginners should never begin with complexity. It should begin with structure, clarity, and consistency.
One of the biggest mistakes beginners make is trying to shortcut the learning process by downloading indicators before they understand what price is actually doing. They follow random chart setups from social media, copy other people’s layouts, and constantly change their screen every few days hoping confidence will magically appear. That creates noise instead of skill. TradingView becomes far more powerful when it is used as a structured learning tool rather than a prediction machine. The goal is not to build the fanciest chart. The goal is to build one repeatable ASX chart setup that helps you read the market clearly every single session. If you want to learn how to build clean ASX stock charts properly instead of piecing random information together online, Start by seeing exactly what is inside the full Trading For Beginners framework first.
Yes Im Ready To Learn Stock Charts Setup For Beginners
See What’s Inside The Trading For Beginners E-Book Before You BuyStock Charts Setup For Beginners – Step 1. Price Comes First
Before adding a single indicator to your chart, strip everything back and remove anything that does not need to be there. Delete old drawings, clear unnecessary indicators, remove clutter, and zoom out so you can see the broader market structure properly. Most beginners spend too much time staring at small movements and not enough time understanding the bigger picture. Price behaviour is the foundation because price is the only thing on the chart showing what buyers and sellers have actually done. Indicators only react to price after the movement has already started. That is why price must always come first in any stock charts setup for beginners.
The first questions should always be simple and structural. Is the ASX stock trending higher, trending lower, or moving sideways? Is price respecting previous highs and lows? Are buyers clearly in control, or is momentum starting to weaken? Is the chart clean enough that you can see support and resistance without forcing the analysis? If you cannot answer those questions from price alone, adding more tools will not fix the problem. It will only make the chart harder to read.
This is where TradingView works extremely well for beginners because it allows you to create a clean charting environment and save the same layout for repeated use. Clean layouts create cleaner thinking because your eyes are not being dragged across unnecessary signals and distractions. Cleaner thinking helps you make better observations, and better observations help you build confidence slowly over time. A beginner does not need a chart full of noise. A beginner needs one clean visual process that can be repeated until the structure starts to make sense.
Stock Charts Setup For Beginners – Step 2. Add The Core 3 Confirmation Tools
Once price structure becomes clear, then you can add a small number of supporting tools to the chart. For trading for beginners, less is usually more because too many indicators create hesitation instead of confidence. The goal is not to predict every future price movement. The goal is to confirm what price behaviour is already showing. A strong beginner chart setup should support structure, not cover it up. This is why I keep the core TradingView setup simple, consistent, and easy to repeat across ASX shares.
- Moving Averages help visualise trend direction and trend alignment.
- RSI helps measure momentum, exhaustion, and market stretch.
- Volume helps confirm participation and conviction behind the move.
These 3 tools are enough for most beginners because they give confirmation without turning the chart into a mess. Moving averages help you see whether price is generally moving with or against the broader trend. RSI helps you understand when momentum is strong, weak, stretched, or losing energy. Volume helps you see whether a move is supported by participation or whether price is moving with little conviction. Together, they create a simple and practical stock chart setup for beginners without overloading the screen. Used correctly, they support decision-making without replacing discipline.
This is also why paper trading matters so much before risking real money. A beginner should practise reading chart structure, placing mock trades, following a routine, and reviewing mistakes before pressure is added through live capital. Paper trading allows you to build familiarity with TradingView while learning how price behaves in real market conditions. It also gives you time to practise without emotionally reacting to every movement. Confidence is not built by rushing. Confidence is built through repetition, structure, and review.
Stock Charts Setup For Beginners – Step 3. Precision Tools Come Last
Once you understand market structure properly, advanced tools like Fibonacci and Elliott Wave start making far more sense. Most beginners struggle with these tools because they try to learn the patterns before they understand how markets actually move. Fibonacci can help measure retracements and extensions within a trend, but it should never replace the structure price is already showing. Elliott Wave can help map market psychology and progression, but it becomes confusing when beginners try to force wave counts onto messy charts. These tools are powerful only when the foundation is already strong. Precision tools should come after structure, not before it.
This is the part most beginners are never taught properly. They are shown advanced technical analysis before they are shown trend direction, support and resistance, timeframe context, risk management, and basic chart behaviour. That is why technical analysis can feel chaotic at the start. The tools are not the problem. The order is the problem. When you learn the market in the correct order, Fibonacci, Elliott Wave, moving averages, RSI, volume, and support and resistance all begin to connect into one clearer picture.
Stop piecing trading together alone.
Start Learning Trading The Right WayStock Charts Setup For Beginners – Why TradingView Works So Well For Trading Beginners
TradingView works well for beginners because it gives you a professional charting environment without forcing you to use every tool at once. You can start with one clean chart layout, save your settings, build watchlists, mark support and resistance, practise paper trading, and slowly add tools as your confidence improves. That matters because beginners need consistency more than complexity. If your chart setup changes every few days, your thinking becomes inconsistent too. If your layout stays the same, your eyes slowly learn what to look for. That is how pattern recognition begins to develop.
For ASX chart setup, TradingView also helps beginners stay focused on structure rather than platform noise. You can zoom out, study longer-term movement, compare timeframes, and use simple tools without being pushed into overcomplication. This is important because trading for beginners should start with understanding what price is doing, not trying to find the perfect indicator. A clean TradingView setup supports that process beautifully. The platform becomes even more useful when it is paired with a proper beginner trading framework. That is when the chart stops feeling random and starts becoming readable.
The key is to treat TradingView as a learning environment first, not just a place to search for trade ideas. Start simple, build your structure, practise with paper trading, and only add precision tools when the foundations are already working. This approach protects beginners from the common trap of thinking more tools equals better analysis. Real clarity often comes from removing what does not matter. Once your chart is clean, your routine becomes easier to follow. Once your routine becomes easier to follow, your confidence can grow in a much more stable way.
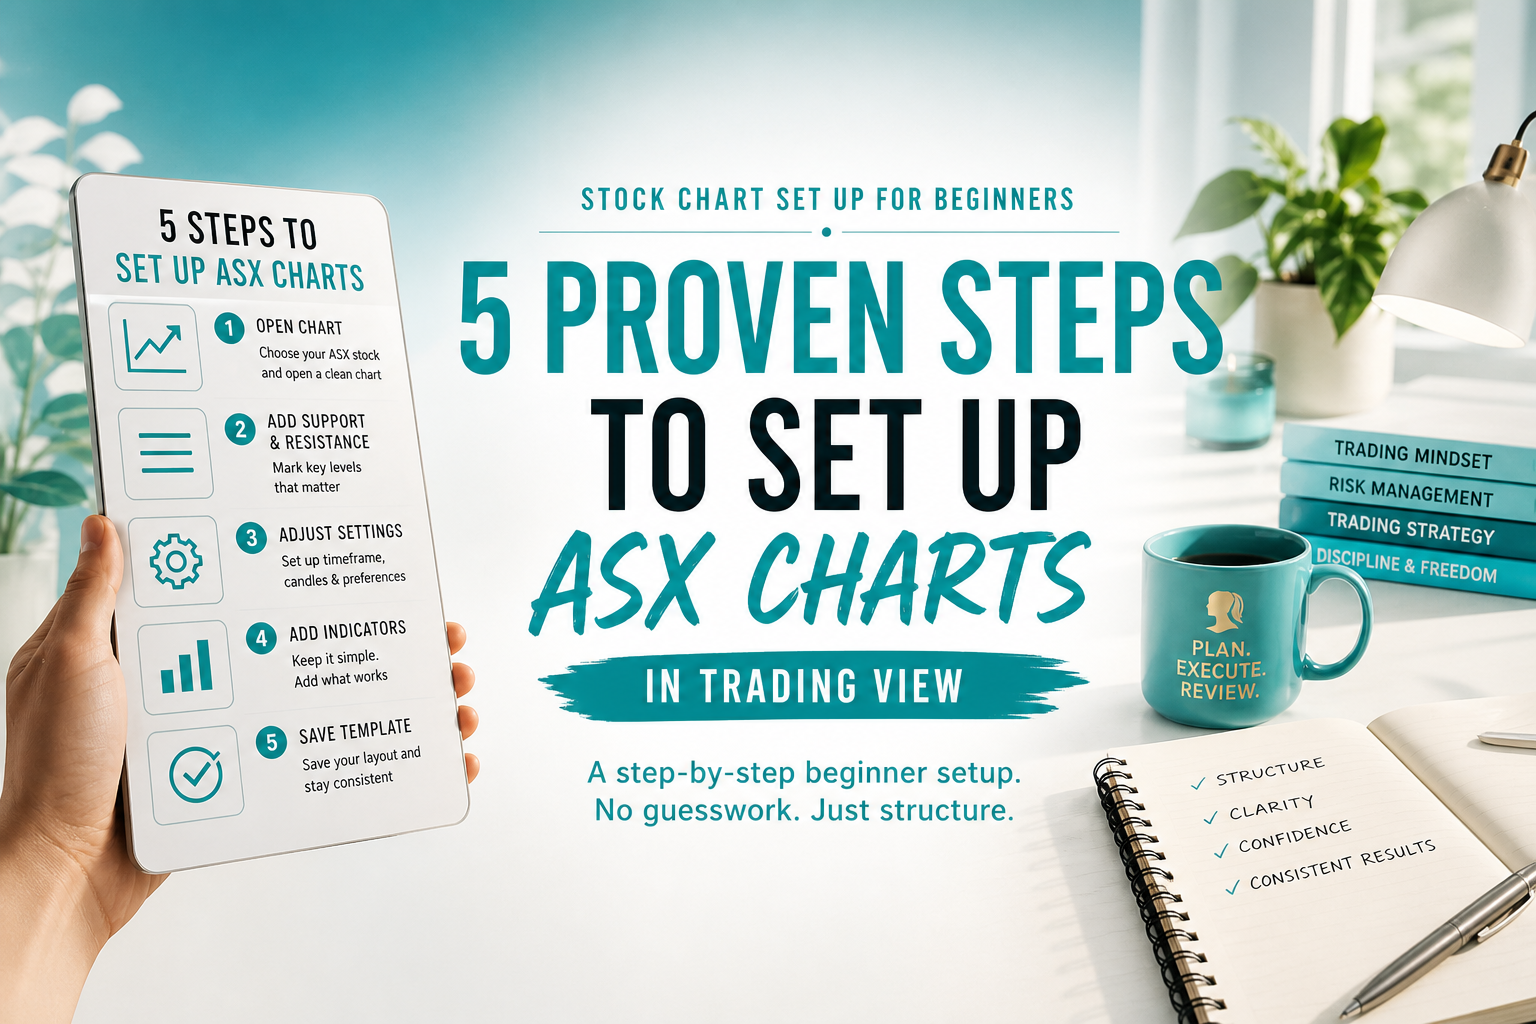
Stock Charts Setup For Beginners – A Simple TradingView Chart Setup Order For Beginners
If you are setting up ASX stock charts in TradingView for the first time, the order matters. Start by opening the chart and removing anything that distracts you from price. Then zoom out enough to see the larger structure instead of judging the market from one tiny section. After that, mark obvious support and resistance levels only if they are clear. Add moving averages, RSI, and volume as confirmation tools, not prediction tools. Then save the layout so you can use the same clean setup every time you return to the chart.
- Clear the chart before adding tools.
- Zoom out and identify the broader structure.
- Mark obvious support and resistance only.
- Add moving averages, RSI, and volume for confirmation.
- Practise the setup through paper trading before using real money.
- Save the TradingView layout so your process stays consistent.
This simple sequence helps beginners avoid one of the biggest early mistakes, which is building a chart around indicators instead of building it around structure. A strong stock charts setup for beginners should make the market easier to understand, not harder. Every tool on the screen should have a clear purpose. If you cannot explain why a tool is there, it probably should not be on the chart yet. The best beginner chart setup is not the one with the most features. It is the one you can read calmly and repeat consistently.
Stock Charts Setup For Beginners – Frequently Asked Questions
Is TradingView good for stock charts setup for beginners?
Yes. TradingView is one of the best charting platforms for beginners because it allows traders to keep layouts clean while still offering advanced tools later as skills improve. It supports ASX chart setup, paper trading, watchlists, alerts, and multiple timeframe analysis in one place. Beginners can start with a simple layout and gradually add tools as they understand more. This makes it easier to learn chart structure without becoming overwhelmed. The key is to use TradingView with discipline instead of filling the chart with unnecessary indicators.
Do I need paid indicators to begin trading?
No. Most beginners do not need paid indicators to begin learning trading properly. In fact, too many indicators can make the chart harder to read because they create conflicting signals and false confidence. A clean beginner setup with price structure, support and resistance, moving averages, RSI, and volume is more than enough while learning. Paid tools do not replace understanding. Structure must come first.
Should beginners use Elliott Wave and Fibonacci immediately?
Not immediately. Elliott Wave and Fibonacci are precision tools, and precision tools work best after the beginner already understands basic market structure. If you use them too early, they can feel confusing and easy to force onto the chart. Once support and resistance, trend direction, timeframe context, and risk management make sense, these tools become far more useful. The order matters. Beginners should always build foundations first.
Stock Charts Setup For Beginners – Where can I learn the full step-by-step trading process?
The full Trading For Beginners framework walks through chart structure, technical analysis, fundamental analysis, risk management, trading psychology, TradingView setup, and portfolio building in a structured beginner-friendly order. It is designed for people who are tired of scattered information and want one clear learning path. The goal is not to make trading sound easy or promise results. The goal is to help beginners learn the market properly before risking real money. If you want the full process on how to set up stock charts for beginners,the e-book brings the pieces together step by step.
Ready to build real trading confidence?
Yes, I Want The AU$49 Trading For Beginners E-Book TodayResource 🔗
After reading all about stock charts setup for beginners and you’re looking for tools, walkthroughs, masterclasses, cheat sheets, and structured guidance, visit the She Trades Shares Resource Hub. This is your central access point to everything we’ve built — from paper trading support to full step-by-step share trading education.
Trading for Beginners Guide – The Ultimate Resource Hub
This is the correct way to set up your stock charts.