Technical Analysis for Beginners-Elliott Wave and Fibonacci, Why Beginners Struggle.
Most beginners struggle with Elliott Wave and Fibonacci because they try to learn the patterns without first understanding market structure. The tools themselves are not the problem. The problem is the order people are taught in. When technical analysis is explained step-by-step, Elliott Wave and Fibonacci become much easier to understand because you begin seeing how price moves within repeating structures instead of random noise. If you want to see how the She Trades Shares Trading For Beginners Course teaches technical analysis, market structure, Elliott Wave, Fibonacci, risk management, and chart reading step-by-step, you can explore exactly what is inside the full framework before you buy.
Want To See What’s In Side The Trading For Beginners Course?
See What You Get Inside The E-Book For $49The She Trades Shares structured e-book is designed to take beginners from absolute basics to structured execution without skipping steps. It starts at foundation level, explains terminology clearly, walks through chart reading logically, and layers tools in the correct order so nothing is left unclear. Instead of scattered tips, it provides a complete learning path that moves from simple to structured. That structure is what prevents confusion and protects beginners from emotional decision-making.
Technical Analysis for Beginners: Understanding Market Structure
Before any advanced tools, technical analysis for beginners starts with understanding market structure. Market structure is simply how price moves in waves, building higher highs and higher lows in uptrends, or lower highs and lower lows in downtrends. When you recognise structure, charts stop feeling random because you can see directional intent. Without structure, indicators become distractions rather than confirmations.
This is why we teach structure before any advanced theory. Beginners often try to apply indicators without understanding the underlying rhythm of price. When structure is clear, tools like Fibonacci or wave theory support the analysis rather than replace it. Technical analysis for beginners becomes easier when the foundation is strong.
Technical Analysis for Beginners: Elliott Wave Explained Simply
Elliott Wave is often misunderstood as complex forecasting, but at its core it describes a repeating rhythm in price behaviour. Markets tend to move in impulsive phases followed by corrective phases, forming a sequence that can be studied and mapped. Technical analysis for beginners does not require mastering every wave variation immediately. It requires recognising that markets expand and contract in patterns rather than moving randomly.
Within the e-book, this concept is explained step by step, beginning with simple impulse and corrective structures before moving into real examples. Nothing is assumed, and no shortcuts are taken. Beginners are shown how structure appears on higher timeframes first, then how it flows down into execution timeframes. That layered teaching avoids overwhelm and builds confidence gradually.
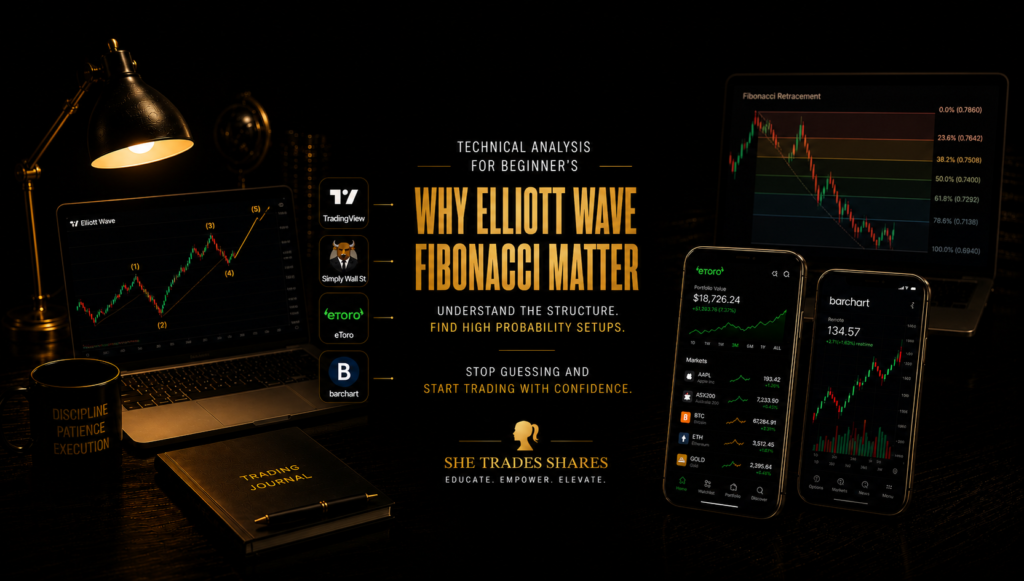
Technical Analysis for Beginners: Why Fibonacci Matters
Fibonacci retracements help traders measure how far a pullback has travelled within a larger trend. These percentage levels often show where price may pause or react because traders use them widely across markets. Technical analysis for beginners benefits from understanding why 38.2%, 50%, and 61.8% appear frequently. They are not magical numbers; they are reference points for probability.
Inside the structured e-book course, Fibonacci is taught in alignment with market structure rather than as a standalone tool. This means you learn when to apply it, where to anchor it correctly, and how it works alongside support and resistance. When tools are layered correctly, they increase clarity instead of adding confusion. That sequencing protects beginners from misusing advanced concepts too early.
Technical Analysis for Beginners: Support and Resistance
Support and resistance form the visible framework of every chart. Support represents areas where buying pressure has previously stepped in, while resistance shows areas where selling pressure has appeared. Technical analysis for beginners becomes far more manageable when these zones are mapped before any trade decision. Price behaviour around these levels often provides context before entry.
Learning to draw clean, logical zones helps traders avoid chasing moves in the middle of nowhere. The e-book builds this skill progressively, starting with clear textbook examples before moving to live chart scenarios. When beginners practise marking levels consistently, pattern recognition improves naturally. That improvement compounds over time.
Technical Analysis for Beginners: Tools We Use Daily
All examples are mapped using TradingView because it provides clean charting, bar-based structure, and accessible paper trading. Technical analysis for beginners should always begin in a risk-free environment before any live capital is involved. Practising on real charts without financial pressure allows patterns and structure to become familiar. Repetition builds confidence far faster than guessing with money on the line.
If you want to practice safely, you can follow our full walkthrough here.
TradingView The Smartest Way To Learn Paper TradingFor a simplified view of company fundamentals alongside charts, Simply Wall St can provide a quick visual overview of financial health. Used correctly, fundamentals and technical structure complement each other rather than compete. Beginners should always understand what they are looking at before acting. Combining clean chart structure with basic company context improves decision quality.
See Structure Applied in Real Time
Reading about technical analysis for beginners is useful, but watching structure applied to a real ASX example builds deeper clarity. The free Online Trading Masterclass walks through market structure on a real stock step by step without hype or prediction. It shows how preparation connects to execution within a disciplined framework. You can view it here: Online Trading Masterclass – ZIP (ASX) .
Final Thoughts
Technical analysis for beginners should never start with complex indicators or aggressive trading. It should begin with structure, discipline, and safe repetition. Tools like Elliott Wave and Fibonacci matter because they provide context within a broader framework, not because they promise certainty. When structure comes first and execution comes last, confidence grows steadily.
If you want the complete beginner path built logically from foundation to execution, the Trading For Beginners Structured E-Book Course provides that roadmap in one place. It removes gaps, explains each layer in order, and ensures nothing is assumed. Instead of piecing lessons together from scattered posts, you follow a coherent plan designed specifically for beginners. Structure protects capital, and education protects confidence.
Yes I am serious about learning trading properly.
Take Me Straight To The Sales Page.Resource 🔗
If you’re looking for tools, walkthroughs, masterclasses, cheat sheets, and structured guidance, visit the She Trades Shares Resource Hub. This is your central access point to everything we’ve built — from paper trading support to full step-by-step share trading education.
Trading for Beginners Guide – The Ultimate Resource Hub